The Causes of Weather
|
Air masses have different temperatures and amounts of moisture because of the uneven heating of Earth’s surface
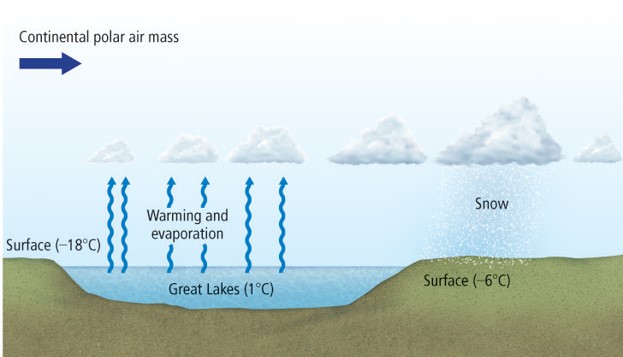
heat: transfer of thermal energy from a warmer material to a cooler material What is meteorology? -Meteorology is the study of atmospheric phenomena. -The root word of meteorology is the Greek word meteoros, which means high in the air. -Short-term variations in atmospheric phenomena that interact and affect the environment and life on Earth are called weather. -Climate is the long-term average of variations in weather for a particular area Weather—from thunderstorms to large-scale weather systems—is part of the constant redistribution of Earth’s thermal energy. Heating Earth’s Surface -One reason that temperatures may vary from location to location at a certain time of year is that Earth’s axis of rotation is tilted relative to the plane of Earth’s orbit. -Solar radiation is unequal partly due to the changing angle of incidence of the sunlight. The greater the area covered by solar radiation, the smaller the amount of heat per unit of area. -The constant movement of air and water redistributes thermal energy around the world. Air Masses -An air mass is a large volume of air that has the same characteristics, such as humidity and temperature, as its source region. -A source region is the area over which an air mass forms. Types of air masses -The origins of maritime tropical air are tropical bodies of water. -The southwestern United States and Mexico are the source regions of continental tropical air, which is hot and dry, especially in summer. -Maritime polar air masses form over the cold waters of the North Atlantic and North Pacific. -Continental polar air masses form over the interior of Canada and Alaska, and carry frigid air southward in the winter. -Earth’s ice- and snow-covered surfaces above 60° N latitude in Siberia and the Arctic Basin are the source regions of arctic air masses. Air mass modification -When an air mass travels over land or water that has characteristics different from those of its source region, the air mass can acquire some of the characteristics of that land or water and undergo modification. -As the cold, continental polar air moves over the warmer Great Lakes, the air gains thermal energy and moisture. This modified air cools as it is uplifted and produces lake-effect snows. WEATHER SYSTEMS Weather results when air masses with different pressures and temperatures move, change, and collide. convection: the transfer of thermal energy by the flow of a heated substance The directions of Earth’s winds are influenced by Earth’s rotation. This Coriolis effect results in fluids and objects moving in an apparent curved path rather than a straight line. Global Wind Systems The directions of Earth’s wind systems, such as the polar easterlies and the trade winds, vary with the latitudes in which they occur. Global Wind Systems- 3 systems 1.Polar easterlies-The polar easterlies are the wind zones between 60° N latitude and the north pole, and 60° S latitude and the south pole. 2.Prevailing westerlies-The prevailing westerlies are the wind systems on Earth located between latitudes 30° N and 60° N, and 30° S and 60° S. 3.Trade winds-Between latitudes 30° N and the equator is a circulation belt of wind known as the trade winds. Trade winds Near latitudes 30° N the sinking air creates an area of high pressure. This results in a belt of weak surface winds called the horse latitudes. Trade winds from the North and the South meet and join near the equator. The air is forced upward, which creates an area of low pressure called the intertropical convergence zone (ITCZ). A large temperature gradient in upper-level air combined with the Coriolis effect results in strong westerly winds called jet streams. A jet stream is a narrow band of fast, high-altitude, westerly wind. Jet Streams Weather in the middle latitudes ( our area)is strongly influenced by fast-moving, high-altitude jet streams. Two Types of jet streams The major jet streams, called the 1.polar jet streams, separate the polar easterlies from the prevailing westerlies. The minor jet streams are the 2.subtropical jet streams. They occur where the trade winds meet the prevailing westerlies. Jet streams and weather systems Storms form along jet streams and can generate large-scale weather systems. Jet streams affect the intensity of weather systems by moving air of different temperatures from one region of Earth to another. Fronts- 4 types A collision of two air masses forms a front—a narrow region between two air masses of different densities. 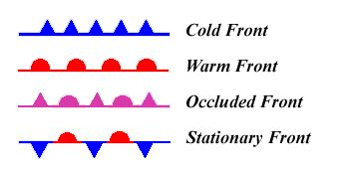
1.Cold front-When cold, dense air displaces warm air, it forces the warm air, which is less dense, up along a steep slope. This type of collision is called a cold front.
Intense precipitation and sometimes thunderstorms. 2.Warm front-Advancing warm air displaces cold air along a warm front. A warm front develops a gradual boundary slope. Widespread light precipitation 3.Stationary front-When two air masses meet but neither advances, the boundary between them stalls. This stationary front frequently occurs between two modified air masses that have small temperature and pressure gradients between them. Sometimes light winds and precipitation 4.Occluded front-Sometimes, a cold air mass moves so rapidly that it overtakes a warm front and forces the warm air upward. As the warm air is lifted, the advancing cold air mass collides with the cold air mass in front of the warm front. A warm air mass is squeezed upward between two cold air masses Strong winds and heavy precipitation Pressure Systems Sinking or rising air, combined with the Coriolis effect, results in the formation of rotating high- and low-pressure systems in the atmosphere. 1.Low-pressure systems-In surface low-pressure systems, air rises. When air from outside the system replaces the rising air, this air spirals inward toward the center and then upward. Clouds and precipitation 2.High-pressure systems-In a surface high-pressure system, sinking air moves away from the system’s center when it reaches Earth’s surface. Clear skies and fair weather. -In the northern hemisphere, winds move counterclockwise around a low-pressure center, and clockwise around a high-pressure center. 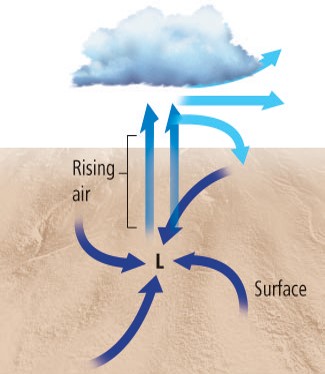
LOW PRESSURE
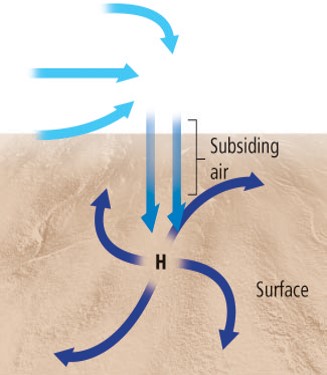
HIGH PRESSURE
|


|
Gathering Weather Data
temperature: the average thermal energy of the particles that make up a substance
Data from Earth’s Surface
Two important factors in weather forecasting are the accuracy of the data and the amount of available data.
Temperature and air pressure
A thermometer measures temperature using either the Fahrenheit or Celsius scale.
A barometer measures air pressure.
Wind speed and relative humidity
An anemometer measures wind speed.
A hygrometer measures relative humidity.
Automated Surface Observing System
The Automated Surface Observing System (ASOS) gathers data in a consistent manner, 24 hours a day, every day. It provides essential weather data for aviation, weather forecasting, and weather-related research.
The instrument used for gathering upper-atmosphere data is a radiosonde.
A radiosonde’s sensors measure the air’s temperature, pressure, and humidity.
Also wind speed and direction( by its movement)
Weather radar
A weather radar system detects specific locations of precipitation.
The Doppler effect is the change in pitch or frequency that occurs due to the relative motion of a wave, such as sound or light, as it comes toward or goes away from an observer.
Doppler radar
Analysis of Doppler radar data can be used to determine the speed at which precipitation moves toward or away from a radar station.
Difference between radar and Doppler radar-
Radar
detects specific locations of precipitation.
Doppler radar
speed at which precipitation moves toward or away from a radar station.
Weather Observation Systems
Weather satellites -3 types of imaging
Infra red
visible light
water vapor imagery.Some satellites use cameras that require visible light to photograph Earth.
These digital photos are sent back to ground stations, and their data are plotted on maps. Unlike weather radar, which tracks precipitation but not clouds, satellites track clouds but not necessarily precipitation.
Weather satellites track clouds and water vapor.
Some weather satellites use infrared imagery to make observations at night.
Objects radiate thermal energy at slightly different frequencies. Infrared imagery detects these different frequencies, which enables meteorologists to map either cloud cover or surface temperatures.
Weather satellites
Another type of satellite imagery that is useful in weather analysis and forecasting is called water-vapor imagery.
Water-vapor imagery is a valuable tool for weather analysis and prediction because it shows moisture in the atmosphere, not just cloud patterns.
Radar
Tracks precipitation
Satellite
Tracks clouds and moisture.
model: an idea, system, or mathematical expression that represents an idea
Surface Weather Analysis
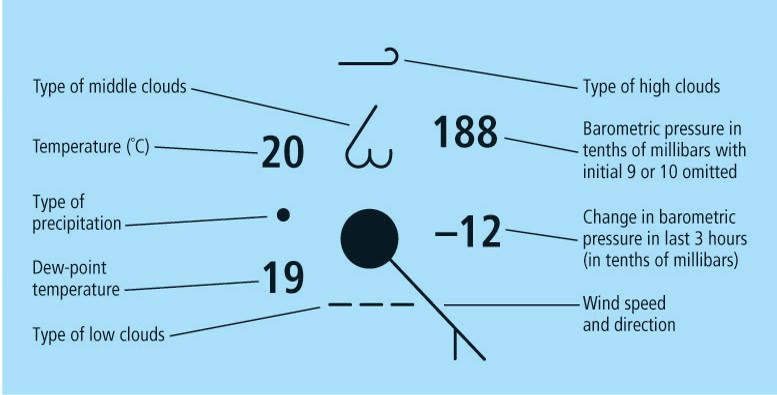
Station models
A station model is a record of weather data for a particular site at a particular time.
Meteorological symbols are used to represent weather data in a station model.
Meteorological symbols are used to represent weather data in a station model. Advantages: universal language, more info in less space.
Data from Earth’s Surface
Two important factors in weather forecasting are the accuracy of the data and the amount of available data.
Temperature and air pressure
A thermometer measures temperature using either the Fahrenheit or Celsius scale.
A barometer measures air pressure.
Wind speed and relative humidity
An anemometer measures wind speed.
A hygrometer measures relative humidity.
Automated Surface Observing System
The Automated Surface Observing System (ASOS) gathers data in a consistent manner, 24 hours a day, every day. It provides essential weather data for aviation, weather forecasting, and weather-related research.
The instrument used for gathering upper-atmosphere data is a radiosonde.
A radiosonde’s sensors measure the air’s temperature, pressure, and humidity.
Also wind speed and direction( by its movement)
Weather radar
A weather radar system detects specific locations of precipitation.
The Doppler effect is the change in pitch or frequency that occurs due to the relative motion of a wave, such as sound or light, as it comes toward or goes away from an observer.
Doppler radar
Analysis of Doppler radar data can be used to determine the speed at which precipitation moves toward or away from a radar station.
Difference between radar and Doppler radar-
Radar
detects specific locations of precipitation.
Doppler radar
speed at which precipitation moves toward or away from a radar station.
Weather Observation Systems
Weather satellites -3 types of imaging
Infra red
visible light
water vapor imagery.Some satellites use cameras that require visible light to photograph Earth.
These digital photos are sent back to ground stations, and their data are plotted on maps. Unlike weather radar, which tracks precipitation but not clouds, satellites track clouds but not necessarily precipitation.
Weather satellites track clouds and water vapor.
Some weather satellites use infrared imagery to make observations at night.
Objects radiate thermal energy at slightly different frequencies. Infrared imagery detects these different frequencies, which enables meteorologists to map either cloud cover or surface temperatures.
Weather satellites
Another type of satellite imagery that is useful in weather analysis and forecasting is called water-vapor imagery.
Water-vapor imagery is a valuable tool for weather analysis and prediction because it shows moisture in the atmosphere, not just cloud patterns.
Radar
Tracks precipitation
Satellite
Tracks clouds and moisture.
model: an idea, system, or mathematical expression that represents an idea
Surface Weather Analysis
Station models
A station model is a record of weather data for a particular site at a particular time.
Meteorological symbols are used to represent weather data in a station model.
Meteorological symbols are used to represent weather data in a station model. Advantages: universal language, more info in less space.
Plotting station model data
To plot data nationwide and globally, meteorologists use lines that connect points of equal or constant values.
Lines of equal pressure are called isobars.
Lines of equal temperature are called isotherms.
Interpreting station model data
Using isobars, isotherms, and station model data, meteorologists can analyze current weather conditions for a particular location.
Types of Forecasts
Digital forecasts
A digital forecast is created by applying physical principles and mathematics to atmospheric variables and then making a prediction about how these variables will change over time.
Analog forecasts
An analog forecast is based on a comparison of current weather patterns to similar weather patterns from the past.
Digital
By analyzing current weather data
Analog
By comparing current weather patterns with similar patterns from the past.
Short-Term Forecasts
The most accurate and detailed forecasts are short term because weather systems change directions, speeds, and intensities over time.
Long-Term Forecasts
Because it is impossible for computers to model every variable that affects the weather at a given time and place, all long-term forecasts are less reliable than short-term forecasts.
Short term forecasts are more reliable.
weather instruments. To make accurate weather forecasts, meteorologists analyze and interpret data gathered from Earth’s surface by
A radiosonde collects upper-atmospheric data.
Doppler radar locates where precipitation occurs.
Weather satellites use infrared, visible-light, or water-vapor imagery to observe and monitor changing weather conditions on Earth.
Several methods are used to develop short-term and long-term weather forecasts.
A station model is used to plot different weather variables.
Meteorologists plot lines on a map that connect variables of equal value to represent nationwide and global trends.
Two kinds of forecasts are digital and analog.
The longer the prediction period, the less reliable the weather forecast
Thunderstorms
Some are capable of producing hail the size of baseballs, swirling tornadoes, and surface winds of more than 160 km/h.
All thunderstorms, regardless of intensity, have certain characteristics in common.
How Thunderstorms Form
1. There must be an abundant source of moisture in the lower levels of the atmosphere.
2. Some mechanism must lift the air so that the moisture can condense and release latent heat.
3. The portion of the atmosphere through which the cloud grows must be unstable.
Limits to Growth
–The air in a thunderstorm will keep rising until:
1. It meets a layer of stable air that it cannot overcome
2. The rate of condensation, which diminishes with height, is insufficient to generate enough latent heat to keep the cloud warmer than the surrounding air
–Typical thunderstorms last only about 30 minutes and individual storms are only about 24 km in diameter.
Types of Thunderstorms
•Thunderstorms are often classified according to the mechanism that caused the air to rise.
Air-Mass Thunderstorms
An air-mass thunderstorm is a thunderstorm that results from the air rising because of unequal heating of Earth’s surface within one air mass.
–Mountain thunderstorms occur when an air mass rises as a result of orographic lifting, which involves air moving up the side of a mountain.
–Sea-breeze thunderstorms are local air-mass thunderstorms caused, in part, by extreme temperature differences between the air over land and the air
over water.
Frontal Thunderstorms
Frontal thunderstorms are thunderstorms that are produced by advancing cold fronts and, more rarely, warm fronts.
Cold-front thunderstorms get their initial lift from the push of the cold air which can produce a line of thunderstorms along the leading edge of the cold front.
Because they are not dependent on daytime heating for their initial lift, cold-front thunderstorms can persist long into the night.
Stages of Development
A thunderstorm usually has three stages: the cumulus stage, the mature stage, and the dissipation stage.
The stages are classified according to the direction in which the air is moving.
Cumulus Stage
In the cumulus stage, air starts to rise nearly vertically upward.
Transported moisture condenses into a visible
cloud and releases
latent heat.
As the cloud droplets
coalesce, they form larger droplets, which eventually
fall to Earth as precipitation
Mature Stage
As precipitation falls, it cools the air around it which becomes more dense than the surrounding air, so it sinks creating downdrafts.
The updrafts and downdrafts form a convection cell.
In the mature stage, nearly equal amounts of updrafts and downdrafts exist side by side in the cumulonimbus cloud.
Dissipation Stage
The supply of warm, moist air runs out because the cool downdrafts cool the area
from which the storm
draws energy.
Without the warm air, the updrafts cease and precipitation can no
longer form.
The dissipation stage is characterized primarily by lingering downdrafts.
Severe Weather
This happens along a cold front that moves into warmer territory and can lift and condense a continuous supply of warm air.
Occasionally, weather events come together in such a way that there is a continuous supply of surface moisture.
Severe Thunderstorms
Cold fronts are usually accompanied by upper-level, low-pressure systems that are marked by pools of cold air, which cause the air to become more unstable.
When the strength of the storm’s updrafts and downdrafts intensifies, the storm is considered to be severe.
Supercells
are self-sustaining, extremely powerful severe thunderstorms, which are characterized by intense, rotating updrafts.
Lightning
Lightning is an electrical discharge caused by the friction of falling and rising ice crystals within strong drafts of a cumulonimbus cloud.
Some atoms lose electrons and become positively charged ions, while other atoms receive the extra electrons and become negatively charged ions.
This creates regions of air with opposite charges.
To relieve the electrical imbalance, an invisible channel of negatively charged air, called a stepped leader, moves from the cloud toward
the ground.
When the stepped leader nears the ground, a channel of positively charged ions, called the return stroke, rushes upward to meet it.
The return stroke surges from the ground to the cloud, illuminating the channel with about 100 million V of electricity.
The Power of Lightning
–A lightning bolt heats the surrounding air to about
30 000°C.
–Thunder is the sound produced as this superheated air rapidly expands and contracts.
–Each year in the United States, lightning accounts for about 7500 forest fires, which result in the loss of millions of acres of forest.
–Lightning strikes in the United States cause a yearly average of 300 injuries and 93 deaths to humans.
The Fury of the Wind
Instead of dispersing over a large area underneath a storm, downdrafts sometimes become concentrated in a local area.
Down bursts are violent downdrafts that are concentrated in a local area and can contain wind speeds of more than 160 km/h.
–Macrobursts can have wind speeds of more than 200 km/h, can last up to 30 minutes, and cause a path of destruction up to 5 km wide.
–Microbursts affect areas of less than 3 km wide but can
have winds exceeding 250 km/h.
Hail
Hail is precipitation in the form of balls or lumps of ice that can do tremendous damage.
Hail forms because of two characteristics common to thunderstorms.
–Water droplets exist in the liquid state in the parts of a cumulonimbus cloud where the temperature is actually below freezing.
–The abundance of strong updrafts and downdrafts existing side by side within a cloud.
The super cooled water droplets in the cloud freeze on contact with other ice pellets and are caught alternately in the updrafts and downdrafts
•The ice pellets are constantly encountering more super cooled water
droplets and growing.
•Eventually they become
too heavy for the
updrafts to keep aloft
and fall to Earth as hail.
Floods
When there are weak wind currents in the upper atmosphere, weather systems and resulting storms move slowly.
Flooding can occur when a storm dumps its rain over a limited location.
If there is abundant moisture throughout the atmosphere, the processes of condensation, coalescence, and precipitation are much more efficient and thus produce more rainfall.
Floods are the main cause of thunderstorm-related deaths in the United States each year.
Tornadoes
A tornado is a violent, whirling column of air in contact with the ground.
Before a tornado reaches the ground, it is called
a funnel cloud.
Tornadoes are often associated with supercells.
The air in a tornado is made visible by dust and debris drawn into the swirling column, or by the condensation of water vapor into a visible cloud
A tornado forms when wind speed and direction change suddenly with height, a phenomenon known as wind shear.
Under the right conditions, this can produce a horizontal rotation near Earth’s surface.
A thunderstorm’s updrafts can tilt the twisting column
of wind from a horizontal to a vertical position.
Air pressure in the center drops as the rotation accelerates.
The extreme pressure gradient between the center and the outer portion of the tornado produces the violent winds associated with tornadoes.
Tornado Classification
–The Fujita tornado intensity scale classifies tornadoes according to their path of destruction, wind speed, and duration.
–The scale ranges from F0, which is characterized by winds of up to 118 km/h, to the violent F5, which can pack winds of more than 500 km/h.
–Most tornadoes do not exceed the F1 category.
–Only about one percent ever reach the violent categories of F4 and F5.
Tornado Distribution
–While tornadoes can occur at any time or place, some places are more conducive to their formation.
–Most tornadoes form in the spring during the late afternoon and evening, when the temperature contrasts between polar air and tropical air are the greatest.
–Tornadoes occur most frequently in a region called “Tornado Alley,” which extends from northern Texas through Oklahoma, Kansas, and Missouri.
Tornado Safety
–In the United States, an average of 80 deaths and
1500 injuries result from tornadoes each year.
–The National Weather Service issues tornado watches and warnings before a tornado actually strikes.
–The agency stresses that despite advanced tracking systems, advance warnings may not be possible.
–Signs of an approaching or developing tornado include the presence of dark, greenish skies, a towering wall of clouds, large hailstones, and a loud, roaring noise similar to that of a freight train.
Tropical Storms
Tropical cyclones are large, rotating, low-pressure storms that form over water during summer and fall in the tropics.
The strongest of these cyclonic storms are known in the United States and other parts of the Atlantic Ocean as hurricanes.
Tropical Cyclones
Tropical cyclones thrive on the tremendous amount of energy in warm, tropical oceans.
This latent heat from water that has evaporated from the ocean is released when the air begins to rise and water vapor condenses.
Rising air creates an area of low pressure at the ocean surface.
The cyclonic rotation of a tropical cyclone begins as warm air moves toward the low-pressure center to replace the air that has risen.
As the moving air approaches the center of the growing storm, it rises, rotating faster and faster as more energy is released through condensation.
Air pressure in the center of the system continues to decrease, while surface wind speeds increase—sometimes in excess of 240 km/h.
As long as atmospheric conditions allow warm air to be fed into the system at the surface and to be removed from the system in the upper atmosphere the process will continue.
Formation of Tropical Cyclones
–Tropical cyclones require two basic conditions to form:
•An abundant supply of very warm ocean water
•Some sort of disturbance to lift warm air and
keep it rising
–These conditions exist in all tropical oceans except the South Atlantic Ocean and the Pacific Ocean west of the South American Coast.
–They occur most frequently in the late summer and
early fall, when Earth’s oceans contain their greatest amount of stored heat energy.
Movement of Tropical Cyclones
Tropical cyclones move according to the wind currents that steer them.
In the deep tropics, tropical cyclones are often caught
up in subtropical high-pressure systems that are
usually present.
They move steadily toward the west, then eventually turn poleward when they reach the far edges of the
high-pressure systems.
There, they are guided by prevailing westerlies and begin to interact with midlatitude systems.
Stages of Tropical Cyclones
–Tropical cyclones usually begin as disturbances that originate either from the ITCZ or as weak, low-pressure systems called tropical waves.
–Only a small percentage these ever develop into hurricanes because conditions throughout the atmosphere must allow rising air to be dispersed into
the upper atmosphere.
–When a disturbance over a tropical ocean acquires a cyclonic circulation around a center of low pressure, it is known as a tropical depression.
–When wind speeds around the low-pressure center of
a tropical depression exceed 65 km/h, the system is called a tropical storm.
–If air pressure continues to fall and winds around the center reach at least 120 km/h, the storm is officially classified as a hurricane.
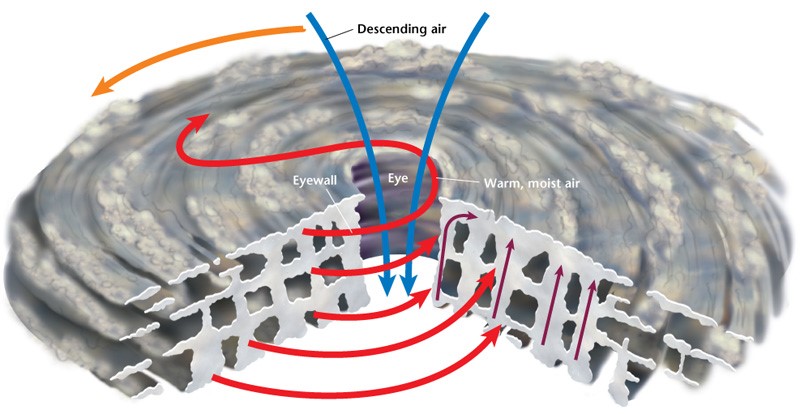
–Once a hurricane, the development of a calm center of the storm, called an eye, takes place.
–The eyewall is a band immediately surrounding the eye that contains the strongest winds in a hurricane.
Classifying Hurricanes
The Saffir-Simpson hurricane scale classifies hurricanes according to wind speed, air pressure in the center, and potential for property damage
The Saffir-Simpson hurricane scale ranges from Category 1 hurricanes to Category 5 storms, which can have winds in excess of 155 mph.
Most of the deadliest hurricanes that strike the United States were classified as major hurricanes.
Running Out of Energy
–A hurricane will last until it can no longer produce enough energy to sustain itself. This usually
happens when:
•The storm moves over land and no longer has access to the warm ocean surface from which
it draws its energy.
•The storm moves over colder water.
Hurricane Hazards
Hurricanes can cause a lot of damage, particularly along coastal areas.
Much of this damage is associated with violent winds of the eyewall, the band about 40 to 80 km wide that surrounds the calm eye.
Storm Surges
–A storm surge occurs when hurricane-force winds drive a mound of ocean water, sometimes as high as 6 m above normal sea level, toward coastal areas where it washes over the land.
–In the northern hemisphere, a storm surge occurs primarily on the right side of a storm relative to its eye, where the strongest onshore winds occur.
–Floods are an additional hurricane hazard, particularly if the storm moves over mountainous areas, where orographic lifting enhances the upward motion of air.
Hurricane Advisories
–The National Hurricane Center, which is responsible
for tracking and forecasting the intensity and motion
of tropical cyclones in the western hemisphere, issues
a hurricane warning at least 24 hours before a
hurricane strikes.
The center also issues regular advisories that indicate
a storm’s position, strength, and movement
–When wind speeds around the low-pressure center of
a tropical depression exceed 65 km/h, the system is called a tropical storm.
–If air pressure continues to fall and winds around the center reach at least 120 km/h, the storm is officially classified as a hurricane.
–Once a hurricane, the development of a calm center of the storm, called an eye, takes place.
–The eyewall is a band immediately surrounding the eye that contains the strongest winds in a hurricane.
Classifying Hurricanes
The Saffir-Simpson hurricane scale classifies hurricanes according to wind speed, air pressure in the center, and potential for property damage
The Saffir-Simpson hurricane scale ranges from Category 1 hurricanes to Category 5 storms, which can have winds in excess of 155 mph.
Most of the deadliest hurricanes that strike the United States were classified as major hurricanes.
Running Out of Energy
–A hurricane will last until it can no longer produce enough energy to sustain itself. This usually
happens when:
•The storm moves over land and no longer has access to the warm ocean surface from which
it draws its energy.
•The storm moves over colder water.
Hurricane Hazards
Hurricanes can cause a lot of damage, particularly along coastal areas.
Much of this damage is associated with violent winds of the eyewall, the band about 40 to 80 km wide that surrounds the calm eye.
Storm Surges
–A storm surge occurs when hurricane-force winds drive a mound of ocean water, sometimes as high as 6 m above normal sea level, toward coastal areas where it washes over the land.
–In the northern hemisphere, a storm surge occurs primarily on the right side of a storm relative to its eye, where the strongest onshore winds occur.
–Floods are an additional hurricane hazard, particularly if the storm moves over mountainous areas, where orographic lifting enhances the upward motion of air.
Hurricane Advisories
–The National Hurricane Center, which is responsible
for tracking and forecasting the intensity and motion
of tropical cyclones in the western hemisphere, issues
a hurricane warning at least 24 hours before a
hurricane strikes.
The center also issues regular advisories that indicate
a storm’s position, strength, and movement
hurricane wilma
Hurricane Wilma-was the most intense tropical cyclone ever recorded in the Atlantic basin, and was the most intense tropical cyclone recorded in the western hemisphere until Hurricane Patricia in 2015. Part of the record-breaking 2005 Atlantic hurricane season, which included three of the six intense Atlantic hurricanes ever, Wilma was the twenty-second storm, thirteenth hurricane, sixth major hurricane, fourth Category 5 hurricane, and second-most destructive hurricane of the 2005 season.

